How To
Enhance marketing by making an infographic on Canva
- August 19, 2022
- Updated: July 2, 2025 at 3:30 AM
When it comes to marketing your products or telling a story in a visual way that’s appealing to the eye, few tools work better than a Canva infographic. You can quickly organize your content, and it gives you the stimulus to be creative. However, we understand that it may be daunting if you’ve never used this feature before.
You don’t need to be an expert to learn how to make an infographic on Canva with its templates. There are a few basic steps you can use, and after that, let your creative mind run wild. Learn how more than 85 million monthly active users in 190 countries are doing the same thing!
How to make an exciting Canva infographic
Select a topic or category
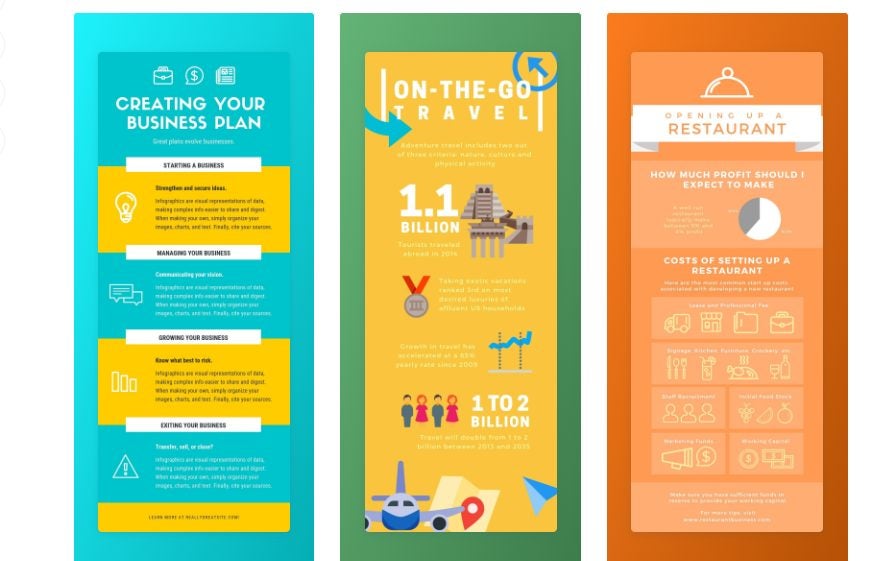
Before you plunge headfirst into making a Canva infographic, you need to decide how you’re going to approach it. The topic or type has a key role to play in which template you’ll aim for. For example, are you wanting to show the results of a survey? Perhaps you want to show a timeline for your business or products.
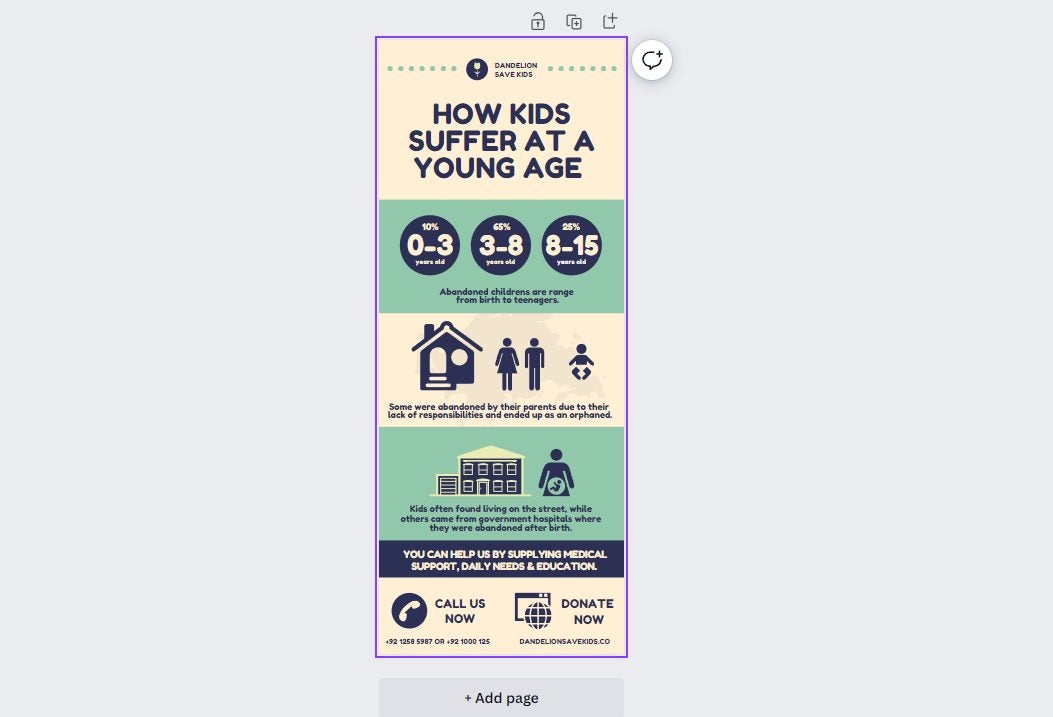
Another type of Canva infographic template that may benefit your business is an annual report or the results of a campaign. The Charity template is a good example of how you can present statistics in a fun and educational way. You can also look at the Volleyball history infographic template to view how a timeline is done.
Design a layout
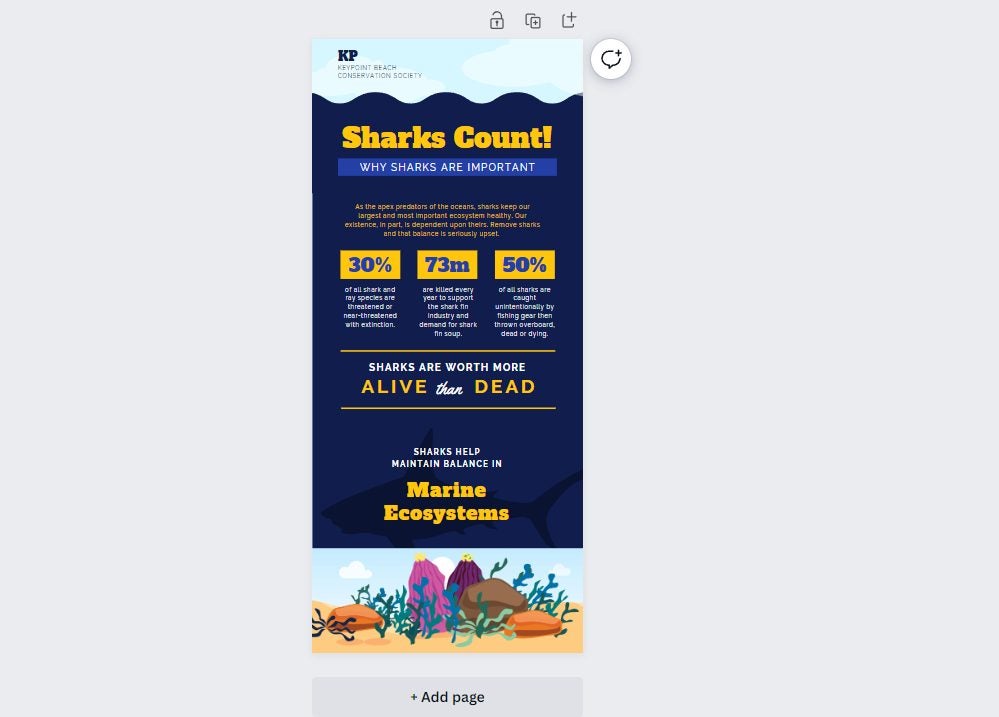
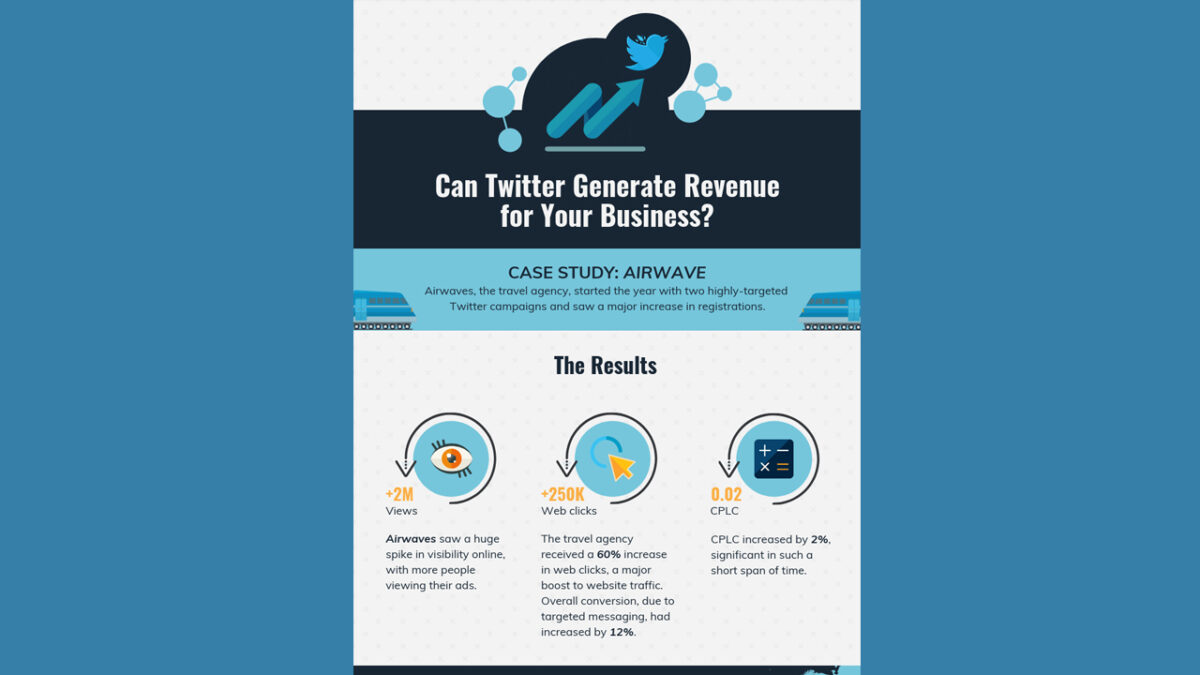
While the Canva infographic templates give you a basis to work on, you still need to decide on the layout you want for your content. Some companies choose one that has a heavy focus on text, such as the Twitter Business template. The Charity template mentioned in the first step has more of a visual appeal, while the Shark Marine Conservation template has the best of both worlds.
It all depends on how much information you need to share with your audience and in what way you want to do so. If there are rich details you don’t want to lose, then the text-heavy option is the way to go. Should you feel that the infographic is too dull and you just want to share stats, you can opt for a more visual layout. Either way, Canva has several templates to meet your requirements!
Organize the content
Have you ever visited a web page with loads of detail and text, and your eyes were drawn to big words with bright colors? This effect is called visual hierarchy. Simply placing the information on a Canva infographic isn’t going to do you or your audience any favors.
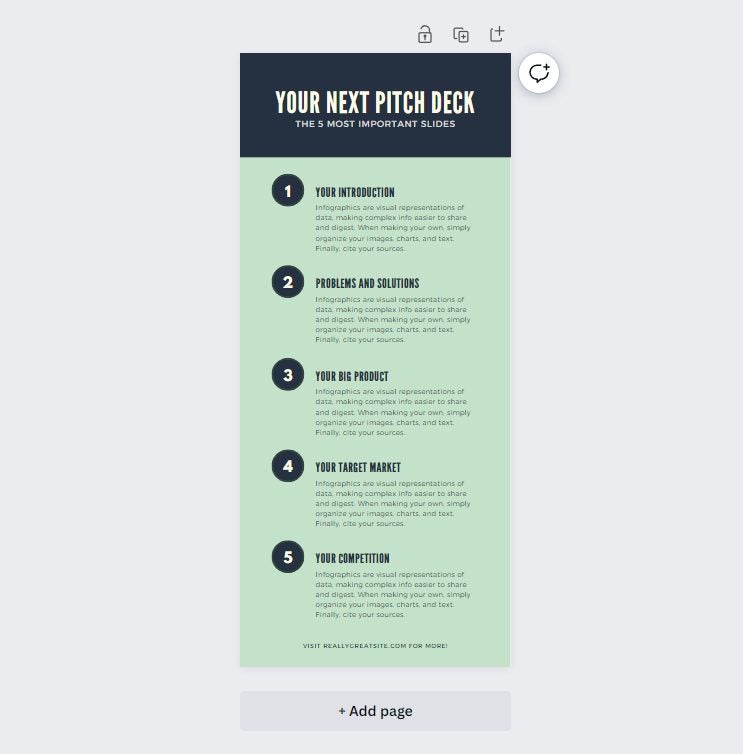
The best approach is to choose which of your content needs to stand out from the others. Look at this Brown Pitch Deck Canva infographic template, as an example. Notice how the headings stand out in various sizes, showing you what to focus on. If you want to know more information about a specific point, you can read the paragraph below.
It helps when your audience is looking for something specific. Their eyes can scan the text to find the top points. You can also work on different color ranges, such as red, green, or blue. If there’s a specific color theme that matches your brand, it’s best to aim for that.
Design the visuals
Can you see how well your Canva infographic is shaping up now, thanks to these outstanding templates?! You’re almost at the finish line. All that’s left now is to take all the aforementioned steps and design the visuals that will complement the data.
The first aspect to consider here is what visual elements you need to include. For example, you can aim for charts, icons, graphs, smiley faces, graphical titles, or even custom images.
Next, you’ll want to decide on an exquisite font, which Canva has loads of. You need to strike a balance by capturing the audience’s attention without confusing them with text they can’t read. The font also needs to match the tone, as you can’t have comical text for a serious presentation.
Finally, don’t forget to add images. Canva has an extensive library of images that you can choose from, but you shouldn’t overdo it. Remember, an infographic has limited space, and you need to use it wisely.
Sharing your infographic
You’re now all set to share your Canva infographic with the world! Once you’ve saved it, you can share it on any social media platform that accepts images in that format. If you’re going to post to Instagram, you may want to aim for a landscape infographic, instead.
It’s all up to you to make your infographic pop as much as possible. To help you get there, you have the remarkable tools that Canva has to offer.

You may also like
 News
NewsHe won the award for best anime of the year and now he returns with a second season
Read more
- News
No other horror movie captured the fear during COVID better, but almost everyone ignored it
Read more
- Article
The most mysterious horror movie of the year brings together the most underrated actress in Hollywood with the boldest director
Read more
- News
40% of ransomware problems end in physical threats to executives
Read more
- News
"If they have done it, we will too" is not a good marketing strategy. Really!
Read more
- News
Hideo Kojima is tired of all video games being the same
Read more